Summer's End Nudges Unemployment Upward
Oct. 20, 2000
No. 01-17
 The end of Alaska's
summer seafood processing season pushed Alaska's statewide unemployment
upward in September. The statewide rate climbed seven-tenths of a percentage
point to 5.0%. The number of unemployed Alaskans increased by nearly 1,800
from August, pushing the total number of unemployed over 16,000. John
Boucher, a labor economist with Alaska Department of Labor and Workforce
Development, reported the change.
The end of Alaska's
summer seafood processing season pushed Alaska's statewide unemployment
upward in September. The statewide rate climbed seven-tenths of a percentage
point to 5.0%. The number of unemployed Alaskans increased by nearly 1,800
from August, pushing the total number of unemployed over 16,000. John
Boucher, a labor economist with Alaska Department of Labor and Workforce
Development, reported the change.
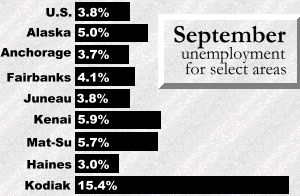
The statewide unemployment rate showed a slight increase when compared to September of 1999. One year ago the unemployment rate was 4.9% and nearly 15,400 Alaskans were unemployed. The corresponding unemployment rate for the U.S. in September was 3.8%.
September's increase in unemployment was strongly linked to the winding down of two prominent Alaska summer industries-fishing and tourism. Fish processing plants shed more than 4,000 jobs statewide in September as the peak salmon processing season passed. Larger than average increases in unemployment in Kodiak, Wrangell-Petersburg, and some areas in Southwest Alaska were largely attributable to declining fish processing employment. Kodiak was particularly hard hit by a disappointing pollock harvest; unemployment soared from 3.4% in August to 15.4% in September. Tourism-related unemployment increases were noted in the Denali and Kenai Peninsula Boroughs, and the Skagway-Hoonah-Angoon Census Area. These hot spots for summer tourism typically experience surges of unemployment as the visitor season winds down.
The lowest unemployment rate in the state was posted in the Haines Borough, where 3.0% of the labor force was unemployed. The state's highest rate was in the Kodiak Island Borough at 15.4%.
Wage and salary employment statistics showed state and local governments accounting for most of the job gains in September, all of them education-related. Nearly every sector of the economy experienced job losses in September, and the net result was a loss of 6,600 jobs. The manufacturing sector in Alaska's coastal regions experienced the greatest job losses as seafood processors let go of employees following the peak salmon processing season.
Labor Force By Region and Census Area
| Category | Labor Force | Unemployment | Rate | Employment | ||||||||
|---|---|---|---|---|---|---|---|---|---|---|---|---|
| Sep-00 | Aug-00 | Sep-99 | Sep-00 | Aug-00 | Sep-99 | Sep-00 | Aug-00 | Sep-99 | Sep-00 | Aug-00 | Sep-99 | |
| Alaska Statewide | 321,958 | 327,797 | 316,197 | 16,024 | 14,249 | 15,409 | 5 | 4.3 | 4.9 | 305,934 | 313,548 | 300,788 |
| Anchorage/Mat-Su Region | 173,596 | 174,234 | 169,153 | 7,115 | 6,556 | 7,135 | 4.1 | 3.8 | 4.2 | 166,481 | 167,678 | 162,018 |
| Municipality of Anchorage | 142,273 | 142,461 | 139,061 | 5,322 | 4,877 | 5,291 | 3.7 | 3.4 | 3.8 | 136,951 | 137,584 | 133,770 |
| Mat-Su Borough | 31,323 | 31,773 | 30,092 | 1,793 | 1,679 | 1,844 | 5.7 | 5.3 | 6.1 | 29,530 | 30,094 | 28,248 |
| Gulf Coast Region | 34,322 | 36,048 | 34,550 | 2,711 | 1,786 | 2,454 | 7.9 | 5 | 7.1 | 31,611 | 34,262 | 32,096 |
| Kenai Peninsula Borough | 21,317 | 23,041 | 22,244 | 1,266 | 1,308 | 1,885 | 5.9 | 5.7 | 8.5 | 20,051 | 21,733 | 20,359 |
| Kodiak Island Borough | 7,918 | 7,520 | 7,085 | 1,216 | 256 | 280 | 15.4 | 3.4 | 4 | 6,702 | 7,264 | 6,805 |
| Valdez-Cordova | 5,087 | 5,486 | 5,220 | 229 | 221 | 288 | 4.5 | 4 | 5.5 | 4,858 | 5,265 | 4,932 |
| Interior Region | 50,035 | 51,302 | 49,296 | 2,300 | 2,211 | 2,294 | 4.6 | 4.3 | 4.7 | 47,735 | 49,091 | 47,002 |
| Denali Borough | 1,196 | 1,206 | 1,179 | 55 | 33 | 56 | 4.6 | 2.7 | 4.7 | 1,141 | 1,173 | 1,123 |
| Fairbanks North Star Borough | 44,281 | 45,427 | 43,643 | 1,837 | 1,778 | 1,851 | 4.1 | 3.9 | 4.2 | 42,444 | 43,649 | 41,792 |
| Southeast Fairbanks | 2,563 | 2,611 | 2,479 | 220 | 201 | 172 | 8.6 | 7.7 | 6.9 | 2,343 | 2,410 | 2,307 |
| Yukon-Koyukuk | 1,995 | 2,057 | 1,995 | 188 | 198 | 215 | 9.4 | 9.6 | 10.8 | 1,807 | 1,859 | 1,780 |
| Northern Region | 8,371 | 8,224 | 7,830 | 900 | 830 | 779 | 10.8 | 10.1 | 9.9 | 7,471 | 7,394 | 7,051 |
| Nome | 3,128 | 3,093 | 2,908 | 319 | 313 | 257 | 10.2 | 10.1 | 8.8 | 2,809 | 2,780 | 2,651 |
| North Slope Borough | 3,239 | 3,157 | 2,981 | 354 | 301 | 258 | 10.9 | 9.5 | 8.7 | 2,885 | 2,856 | 2,723 |
| Northwest Arctic Borough | 2,003 | 1,975 | 1,941 | 226 | 216 | 264 | 11.3 | 10.9 | 13.6 | 1,777 | 1,759 | 1,677 |
| Southeast Region | 40,822 | 42,203 | 40,672 | 1,792 | 1,671 | 1,769 | 4.4 | 4 | 4.3 | 39,030 | 40,532 | 38,903 |
| Haines Borough | 1,181 | 1,217 | 1,179 | 36 | 28 | 38 | 3 | 2.3 | 3.2 | 1,145 | 1,189 | 1,141 |
| Juneau Borough | 17,945 | 18,562 | 17,949 | 680 | 633 | 740 | 3.8 | 3.4 | 4.1 | 17,265 | 17,929 | 17,209 |
| Ketchikan Gateway Borough | 7,496 | 7,741 | 7,472 | 366 | 336 | 365 | 4.9 | 4.3 | 4.9 | 7,130 | 7,405 | 7,107 |
| Pr. of Wales-Outer Ketchikan | 3,348 | 3,502 | 3,297 | 248 | 282 | 207 | 7.4 | 8.1 | 6.3 | 3,100 | 3,220 | 3,090 |
| Sitka Borough | 4,564 | 4,736 | 4,565 | 146 | 148 | 162 | 3.2 | 3.1 | 3.5 | 4,418 | 4,588 | 4,403 |
| Skagway-Hoonah-Angoon | 2,355 | 2,411 | 2,297 | 116 | 85 | 65 | 4.9 | 3.5 | 2.8 | 2,239 | 2,326 | 2,232 |
| Wrangell-Petersburg | 3,610 | 3,700 | 3,586 | 182 | 140 | 169 | 5 | 3.8 | 4.7 | 3,428 | 3,560 | 3,417 |
| Yakutat Borough | 322 | 335 | 326 | 18 | 19 | 23 | 5.6 | 5.7 | 7.1 | 304 | 316 | 303 |
| Southwest Region | 14,811 | 15,786 | 14,696 | 1,206 | 1,194 | 979 | 8.1 | 7.6 | 6.7 | 13,605 | 14,592 | 13,717 |
| Aleutians East Borough | 1,599 | 1,673 | 1,573 | 64 | 27 | 25 | 4 | 1.6 | 1.6 | 1,535 | 1,646 | 1,548 |
| Aleutians West | 1,957 | 2,086 | 1,954 | 100 | 94 | 81 | 5.1 | 4.5 | 4.1 | 1,857 | 1,992 | 1,873 |
| Bethel | 6,190 | 6,588 | 6,173 | 557 | 546 | 493 | 9 | 8.3 | 8 | 5,633 | 6,042 | 5,680 |
| Bristol Bay Borough | 602 | 644 | 599 | 27 | 28 | 20 | 4.5 | 4.3 | 3.3 | 575 | 616 | 579 |
| Dillingham | 1,741 | 1,850 | 1,757 | 93 | 83 | 96 | 5.3 | 4.5 | 5.5 | 1,648 | 1,767 | 1,661 |
| Lake & Peninsula Borough | 593 | 631 | 565 | 51 | 50 | 19 | 8.6 | 7.9 | 3.4 | 542 | 581 | 546 |
| Wade Hampton | 2,127 | 2,313 | 2,074 | 312 | 366 | 244 | 14.7 | 15.8 | 11.8 | 1,815 | 1,947 | 1,830 |
Alaska Nonagricultural Wage & Salary Employment
| preliminary | revised | Changes from: | |||
|---|---|---|---|---|---|
| Sep-00 | Aug-00 | Sep-99 | Aug-00 | Sep-99 | |
| Total Nonagricultural Employment | 295,300 | 301,900 | 292,200 | -6,600 | 3,100 |
| Mining | 10,200 | 10,100 | 9,300 | 100 | 900 |
| Construction | 17,000 | 17,800 | 16,600 | -800 | 400 |
| Manufacturing | 15,500 | 19,700 | 17,400 | -4,200 | -1,900 |
| Transportation, Commun. & Utilities | 28,700 | 29,400 | 28,200 | -700 | 500 |
| Trade | 60,400 | 62,100 | 60,000 | -1,700 | 400 |
| Finance, Insurance & Real Estate | 12,900 | 13,300 | 13,000 | -400 | -100 |
| Services & Misc. | 76,100 | 78,300 | 73,800 | -2,200 | 2,300 |
| Government | 74,500 | 71,200 | 73,900 | 3,300 | 600 |
| Month | Alaska | U.S. |
|---|---|---|
| September 2000 | 6.3% | 3.9% |
| August 2000 | 5.8% | 4.1% |
| September 1999 | 5.6% | 4.2% |
*Government includes employees of
public schools and the University of Alaska.
Benchmark date: March 1999
Source: Alaska Department of Labor and Workforce Development, Research and Analysis Section.
###
last updated: 07/07/2026