Unemployment Does Its Midwinter Rise
Feb. 16, 2001
No. 01-39
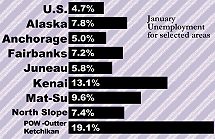 Alaska's statewide jobless rate rose to 7.8% in January. This was an increase of one and seven-tenths of a percentage point from December's 6.1% rate. Normal seasonal slowdowns drove the increase. The number of unemployed Alaskans also increased to nearly 25,000, about 5,400 more unemployed than in December. Rachel Baker, a labor economist with the Alaska Department of Labor and Workforce Development, reported the increase. The comparable national unemployment rate (civilian not seasonally adjusted) in January was 4.7%.
January is typically the peak month for unemployment in Alaska as seasonal industries reach a mid-winter low point. Although January's unemployment rate was an increase from the previous month, it remains in the range of relatively low rates recorded since 1998, which indicates that Alaska's job market remains fairly tight. Before 1998, unemployment rates of nine percent or higher were typical in January.
Jobless rates moved higher in most areas of the state 1`in January. Unemployment rates were in excess of ten percent in 18 of the 27 areas where these rates are calculated. The one exception to the trend toward higher unemployment was Kodiak, which benefited from Tanner crab, pollock, and cod openings. Kodiak's unemployment rate fell from 13.3% in December to 11.4% in January.
The seasonal slowdown was also evident in Alaska's wage and salary employment count. In January, retail trade, services, construction, and government were the largest contributors to the loss of 7,100 jobs. Seafood processing employment provided the only employment boost in January, adding 3,200 jobs, primarily in the Southwest and Gulf Coast regions of the state.
Despite the seasonal employment decline, Alaska's over-the-year job growth held steady at just over two percent in January. Continued strength in Alaska's services and oil and gas sectors provided a significant portion of the employment growth. The seafood processing and food store sectors were the most significant negatives in over-the-year growth. Supermarket closures in the Fairbanks, Mat-Su, and Anchorage areas have resulted in a loss of 400 jobs in the food store sector since January 2000.
|
Laborforce by Region and Census Area |
||||||||||||
| Labor Force | Unemployment | Rate | Employment | |||||||||
| 01/01 | 12/00 | 01/00 | 01/01 | 12/00 | 01/00 | 01/01 | 12/00 | 01/00 | 01/01 | 12/00 | 01/00 | |
| Alaska Statewide | 321,548 | 320,588 | 314,939 | 24,984 | 19,547 | 27,887 | 7.8 | 6.1 | 8.9 | 296,564 | 301,041 | 287,052 |
| Anchorage/Mat-Su Region | 178,949 | 180,474 | 173,913 | 10,426 | 8,385 | 11,619 | 5.8 | 4.6 | 6.7 | 168,523 | 172,089 | 162,294 |
| Municipality of Anchorage | 147,743 | 148,623 | 143,918 | 7,421 | 6,060 | 8,368 | 5.0 | 4.1 | 5.8 | 140,322 | 142,563 | 135,550 |
| Mat-Su Borough | 31,206 | 31,851 | 29,995 | 3,005 | 2,325 | 3,251 | 9.6 | 7.3 | 10.8 | 28,201 | 29,526 | 26,744 |
| Gulf Coast Region | 31,913 | 31,271 | 32,120 | 4,086 | 3,431 | 4,640 | 12.8 | 11.0 | 14.4 | 27,827 | 27,840 | 27,480 |
| Kenai Peninsula Borough | 20,536 | 19,928 | 21,006 | 2,698 | 2,082 | 3,391 | 13.1 | 10.4 | 16.1 | 17,838 | 17,846 | 17,615 |
| Kodiak Island Borough | 6,514 | 6,663 | 6,247 | 740 | 886 | 545 | 11.4 | 13.3 | 8.7 | 5,774 | 5,777 | 5,702 |
| Valdez-Cordova | 4,862 | 4,680 | 4,866 | 647 | 463 | 704 | 13.3 | 9.9 | 14.5 | 4,215 | 4,217 | 4,162 |
| Interior Region | 47,996 | 49,084 | 47,564 | 3,936 | 3,040 | 4,586 | 8.2 | 6.2 | 9.6 | 44,060 | 46,044 | 42,978 |
| Denali Borough | 1,151 | 1,169 | 1,189 | 148 | 121 | 211 | 12.9 | 10.4 | 17.7 | 1,003 | 1,048 | 978 |
| Fairbanks North Star Borough | 42,153 | 43,216 | 41,686 | 3,033 | 2,334 | 3,526 | 7.2 | 5.4 | 8.5 | 39,120 | 40,882 | 38,160 |
| Southeast Fairbanks | 2,592 | 2,602 | 2,605 | 383 | 294 | 451 | 14.8 | 11.3 | 17.3 | 2,209 | 2,308 | 2,154 |
| Yukon-Koyukuk | 2,101 | 2,097 | 2,085 | 372 | 291 | 399 | 17.7 | 13.9 | 19.1 | 1,729 | 1,806 | 1,686 |
| Northern Region | 9,475 | 9,256 | 8,656 | 1,030 | 800 | 1,017 | 10.9 | 8.6 | 11.7 | 8,445 | 8,456 | 7,639 |
| Nome | 3,569 | 3,508 | 3,279 | 403 | 338 | 415 | 11.3 | 9.6 | 12.7 | 3,166 | 3,170 | 2,864 |
| North Slope Borough | 3,523 | 3,488 | 3,244 | 261 | 221 | 293 | 7.4 | 6.3 | 9.0 | 3,262 | 3,267 | 2,951 |
| Northwest Arctic Borough | 2,381 | 2,260 | 2,133 | 365 | 241 | 309 | 15.3 | 10.7 | 14.5 | 2,016 | 2,019 | 1,824 |
| Southeast Region | 37,698 | 37,733 | 37,377 | 3,707 | 2,577 | 4,210 | 9.8 | 6.8 | 11.3 | 33,991 | 35,156 | 33,167 |
| Haines Borough | 1,220 | 1,200 | 1,211 | 193 | 138 | 209 | 15.8 | 11.5 | 17.3 | 1,027 | 1,062 | 1,002 |
| Juneau Borough | 15,988 | 16,331 | 15,732 | 924 | 750 | 1,033 | 5.8 | 4.6 | 6.6 | 15,064 | 15,581 | 14,699 |
| Ketchikan Gateway Borough | 7,268 | 7,265 | 7,266 | 745 | 518 | 901 | 10.3 | 7.1 | 12.4 | 6,523 | 6,747 | 6,365 |
| Pr. of Wales-Outer Ketchikan | 3,179 | 3,017 | 3,256 | 607 | 357 | 746 | 19.1 | 11.8 | 22.9 | 2,572 | 2,660 | 2,510 |
| Sitka Borough | 4,056 | 4,110 | 3,988 | 269 | 193 | 293 | 6.6 | 4.7 | 7.3 | 3,787 | 3,917 | 3,695 |
| Skagway-Hoonah-Angoon | 2,147 | 2,087 | 2,105 | 369 | 248 | 370 | 17.2 | 11.9 | 17.6 | 1,778 | 1,839 | 1,735 |
| Wrangell-Petersburg | 3,535 | 3,426 | 3,522 | 551 | 339 | 610 | 15.6 | 9.9 | 17.3 | 2,984 | 3,087 | 2,912 |
| Yakutat Borough | 303 | 298 | 297 | 48 | 34 | 48 | 15.8 | 11.4 | 16.2 | 255 | 264 | 249 |
| Southwest Region | 15,518 | 12,770 | 15,309 | 1,800 | 1,313 | 1,815 | 11.6 | 10.3 | 11.9 | 13,718 | 11,457 | 13,494 |
| Aleutians East Borough | 1,642 | 1,361 | 1,632 | 145 | 111 | 159 | 8.8 | 8.2 | 9.7 | 1,497 | 1,250 | 1,473 |
| Aleutians West | 2,234 | 1,793 | 2,179 | 344 | 215 | 320 | 15.4 | 12.0 | 14.7 | 1,890 | 1,578 | 1,859 |
| Bethel | 6,382 | 5,281 | 6,274 | 612 | 462 | 598 | 9.6 | 8.7 | 9.5 | 5,770 | 4,819 | 5,676 |
| Bristol Bay Borough | 524 | 432 | 532 | 70 | 53 | 85 | 13.4 | 12.3 | 16.0 | 454 | 379 | 447 |
| Dillingham | 1,831 | 1,509 | 1,858 | 159 | 112 | 213 | 8.7 | 7.4 | 11.5 | 1,672 | 1,397 | 1,645 |
| Lake & Peninsula Borough | 639 | 525 | 615 | 76 | 55 | 61 | 11.9 | 10.5 | 9.9 | 563 | 470 | 554 |
| Wade Hampton | 2,265 | 1,868 | 2,219 | 394 | 305 | 379 | 17.4 | 16.3 | 17.1 | 1,871 | 1,563 | 1,840 |
|
Alaska Nonagricultural Wage & Salary Employment |
|||||
| P/ | R/ | Changes From: | |||
| 01/01 | 12/00 | 01/00 | 12/00 | 01/00 | |
| Total Nonagricultural Employment | 266,600 | 273,700 | 261,200 | -7,100 | 5,400 |
| Mining | 10,700 | 11,000 | 8,900 | -300 | 1,800 |
| Construction | 11,300 | 12,600 | 11,000 | -1,300 | 300 |
| Manufacturing | 10,400 | 7,700 | 10,900 | 2,700 | -500 |
| Transportation, Communications. & Utilities | 25,100 | 25,400 | 24,900 | -300 | 200 |
| Trade | 54,000 | 57,700 | 53,200 | -3,700 | 800 |
| Finance, Insurance & Real Estate | 12,300 | 12,600 | 12,400 | -300 | -100 |
| Services & Misc. | 69,800 | 71,400 | 67,200 | -1,600 | 2,600 |
| Government | 73,000 | 75,300 | 72,700 | -2,300 | 300 |
|
Seasonally Adjusted Unemployment Rates |
||
| January 2001: | Alaska 6.1% | U.S. 4.2% |
| December 2000: | Alaska 5.9% | U.S. 4.0% |
| January 2000: | Alaska 7.0% | U.S. 4.0% |
Benchmark: March 2000 Source: Alaska Department of Labor and Workforce Development, Research and Analysis Section.
- Comparisons between different time periods are not as meaningful as other time series produced by Research and Analysis.
- The official definition of unemployment currently in place excludes anyone who has not made an active attempt to find work in the four-week period up to and including the week that includes the 12th of the reference month. Due to the scarcity of employment opportunities in rural Alaska locations, many individuals do not meet the official definition of unemployed because they have not conducted an active job search. These individuals are considered not in the labor force.
###