Unemployment Begins Seasonal Decline
Apr. 20, 2001
No. 01-50
 Alaska's
statewide unemployment rate began a seasonal decline in March, dropping
to 6.7% from the 7.5% rate recorded in February. The number of unemployed
Alaskans dropped by more than 2,500 to just over 21,600 in March. In March
2000, there were more than 25,000 unemployed Alaskans. The comparable
national unemployment rate in March was 4.6%.
Alaska's
statewide unemployment rate began a seasonal decline in March, dropping
to 6.7% from the 7.5% rate recorded in February. The number of unemployed
Alaskans dropped by more than 2,500 to just over 21,600 in March. In March
2000, there were more than 25,000 unemployed Alaskans. The comparable
national unemployment rate in March was 4.6%.
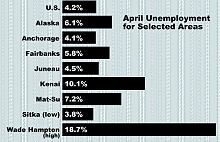
March's seasonal unemployment decline was felt across most of the state as rates fell in nearly every area. Exceptions were noted in Bethel, the Aleutians West Census Area, and Kodiak, where the March rate remained unchanged from February. The Wade Hampton Census Area had the highest unemployment rate in the state at 17.9%, while the Aleutians East Borough posted the lowest rate at 3.6%.
Brisk construction activity contributed to the relatively low statewide unemployment rate. Although 2000 was a good year for Alaska's construction industry, this year's season is shaping up to be even better. As an indication, the number of unemployment weeks paid for the construction industry in March 2001 was 13.5% below the March 2000 statewide level. Significant over-the-year declines in weeks paid to unemployed construction workers took place in Anchorage and Fairbanks.
A statewide increase of 3,100 wage and salary jobs accompanied March's unemployment decline. Every major sector of Alaska's economy except seafood processing added jobs last month. Seasonal gains in mining, construction, and transportation contributed to job growth. Employment growth in the services industry was broad-based while retail trade's depended largely on additional jobs in eating and drinking places.
Over-the-year
employment growth in March was strong for Alaska's mining and services
industries. Nearly 1,600 jobs have been added to the state's oil
and gas sector since March 2000. The manufacturing and finance sectors
were the only over-the-year job losers in March. Additional job losses
in seafood processing, particularly in the Southwest region, and the
continuing downward trend in the number of lumber and wood products
jobs combined to pull down manufacturing employment in March.
LaborForce by Region and Census Area
|
Labor
Force
|
Unemployment
|
Rate
|
Employment
|
|||||||||
|
03/01
|
02/01
|
03/00
|
03/01
|
02/01
|
03/00
|
03/01
|
02/01
|
03/00
|
03/01
|
02/01
|
03/00
|
|
|
Alaska
Statewide
|
322,077
|
322,086
|
314,778
|
21,627
|
24,136
|
25,049
|
6.7
|
7.5
|
8.0
|
300,450
|
297,950
|
289,729
|
|
Anchorage/
Mat-Su Region |
177,647
|
177,261
|
171,901
|
9,139
|
10,190
|
10,788
|
5.1
|
5.7
|
6.3
|
168,508
|
167,071
|
161,113
|
|
Municipality
of Anchorage |
146,105
|
145,948
|
141,857
|
6,509
|
7,209
|
7,767
|
4.5
|
4.9
|
5.5
|
139,596
|
138,739
|
134,090
|
|
Mat-Su
Borough
|
31,542
|
31,313
|
30,044
|
2,630
|
2,981
|
3,021
|
8.3
|
9.5
|
10.1
|
28,912
|
28,332
|
27,023
|
|
Gulf
Coast Region
|
32,415
|
32,643
|
32,441
|
3,406
|
3,876
|
3,928
|
10.5
|
11.9
|
12.1
|
29,009
|
28,767
|
28,513
|
|
Kenai
Peninsula
Borough |
21,034
|
21,193
|
21,230
|
2,438
|
2,753
|
2,952
|
11.6
|
13.0
|
13.9
|
18,596
|
18,440
|
18,278
|
|
Kodiak
Island
Borough |
6,419
|
6,365
|
6,337
|
399
|
396
|
420
|
6.2
|
6.2
|
6.6
|
6,020
|
5,969
|
5,917
|
|
Valdez-Cordova
|
4,962
|
5,084
|
4,875
|
568
|
727
|
556
|
11.4
|
14.3
|
11.4
|
4,394
|
4,357
|
4,319
|
|
Interior
Region
|
48,503
|
48,294
|
47,702
|
3,528
|
3,894
|
4,179
|
7.3
|
8.1
|
8.8
|
44,975
|
44,400
|
43,523
|
|
Denali
Borough
|
1,145
|
1,147
|
1,162
|
122
|
137
|
172
|
10.7
|
11.9
|
14.8
|
1,023
|
1,010
|
990
|
|
Fairbanks
North Star Borough
|
42,703
|
42,438
|
41,915
|
2,770
|
3,016
|
3,271
|
6.5
|
7.1
|
7.8
|
39,933
|
39,422
|
38,644
|
|
Southeast
Fairbanks
|
2,550
|
2,576
|
2,536
|
296
|
350
|
354
|
11.6
|
13.6
|
14.0
|
2,254
|
2,226
|
2,182
|
|
Yukon-Koyukuk
|
2,104
|
2,133
|
2,089
|
340
|
391
|
382
|
16.2
|
18.3
|
18.3
|
1,764
|
1,742
|
1,707
|
|
Northern
Region
|
9,383
|
9,490
|
8,815
|
1,014
|
1,091
|
1,027
|
10.8
|
11.5
|
11.7
|
8,369
|
8,399
|
7,788
|
|
Nome
|
3,530
|
3,582
|
3,356
|
392
|
433
|
436
|
11.1
|
12.1
|
13.0
|
3,138
|
3,149
|
2,920
|
|
North
Slope Borough
|
3,504
|
3,519
|
3,302
|
271
|
274
|
293
|
7.7
|
7.8
|
8.9
|
3,233
|
3,245
|
3,009
|
|
Northwest
Arctic Borough |
2,348
|
2,389
|
2,157
|
350
|
384
|
298
|
14.9
|
16.1
|
13.8
|
1,998
|
2,005
|
1,859
|
|
Southeast
Region
|
38,442
|
38,131
|
37,990
|
2,983
|
3,431
|
3,485
|
7.8
|
9.0
|
9.2
|
35,459
|
34,700
|
34,505
|
|
Haines
Borough
|
1,245
|
1,247
|
1,247
|
174
|
199
|
205
|
14.0
|
16.0
|
16.4
|
1,071
|
1,048
|
1,042
|
|
Juneau
Borough
|
16,533
|
16,329
|
16,267
|
818
|
951
|
975
|
4.9
|
5.8
|
6.0
|
15,715
|
15,378
|
15,292
|
|
Ketchikan
Gateway
Borough |
7,457
|
7,352
|
7,384
|
652
|
693
|
762
|
8.7
|
9.4
|
10.3
|
6,805
|
6,659
|
6,622
|
|
Pr.
of Wales-
Outer Ketchikan |
3,163
|
3,187
|
3,215
|
480
|
561
|
604
|
15.2
|
17.6
|
18.8
|
2,683
|
2,626
|
2,611
|
|
Sitka
Borough
|
4,164
|
4,133
|
4,077
|
213
|
267
|
233
|
5.1
|
6.5
|
5.7
|
3,951
|
3,866
|
3,844
|
|
Skagway-
Hoonah-Angoon |
2,126
|
2,119
|
2,047
|
271
|
304
|
242
|
12.7
|
14.3
|
11.8
|
1,855
|
1,815
|
1,805
|
|
Wrangell-Petersburg
|
3,445
|
3,460
|
3,451
|
332
|
413
|
422
|
9.6
|
11.9
|
12.2
|
3,113
|
3,047
|
3,029
|
|
Yakutat
Borough
|
309
|
305
|
301
|
43
|
44
|
42
|
13.9
|
14.4
|
14.0
|
266
|
261
|
259
|
|
Southwest
Region
|
15,688
|
16,267
|
15,930
|
1,557
|
1,654
|
1,642
|
9.9
|
10.2
|
10.3
|
14,131
|
14,613
|
14,288
|
|
Aleutians
East
Borough |
1,600
|
1,656
|
1,617
|
58
|
61
|
58
|
3.6
|
3.7
|
3.6
|
1,542
|
1,595
|
1,559
|
|
Aleutians
West
|
2,093
|
2,153
|
2,131
|
146
|
140
|
163
|
7.0
|
6.5
|
7.6
|
1,947
|
2,013
|
1,968
|
|
Bethel
|
6,578
|
6,791
|
6,655
|
634
|
644
|
645
|
9.6
|
9.5
|
9.7
|
5,944
|
6,147
|
6,010
|
|
Bristol
Bay Borough
|
525
|
559
|
561
|
57
|
75
|
88
|
10.9
|
13.4
|
15.7
|
468
|
484
|
473
|
|
Dillingham
|
1,892
|
1,979
|
1,933
|
169
|
198
|
191
|
8.9
|
10.0
|
9.9
|
1,723
|
1,781
|
1,742
|
|
Lake
& Peninsula
Borough |
655
|
699
|
654
|
75
|
99
|
68
|
11.5
|
14.2
|
10.4
|
580
|
600
|
586
|
|
Wade
Hampton
|
2,346
|
2,431
|
2,377
|
419
|
438
|
428
|
17.9
|
18.0
|
18.0
|
1,927
|
1,993
|
1,949
|
|
Benchmark:
March 2000
|
||||||||||||
|
Alaska
Nonagricultural Wage & Salary Employment
|
|||||
| Preliminary | Revised | Changes From: | |||
|
03/01
|
02/01
|
03/00
|
02/01
|
03/00
|
|
| Total Nonagricultural Employment | 276,600 | 273,500 | 271,900 | 3,100 | 4,700 |
| Mining | 11,100 | 11,000 | 9,500 | 100 | 1,600 |
| Construction | 12,100 | 11,600 | 11,700 | 500 | 400 |
| Manufacturing | 13,100 | 13,200 | 13,600 | -100 | -500 |
| Transportation, Commun. & Utilities | 25,600 | 25,200 | 25,600 | 400 | 0 |
| Trade | 54,400 | 53,700 | 53,800 | 700 | 600 |
| Finance, Insurance & Real Estate | 12,400 | 12,400 | 12,500 | 0 | -100 |
| Services & Misc. | 71,800 | 71,000 | 69,300 | 800 | 2,500 |
| Government | 76,100 | 75,400 | 75,900 | 700 | 200 |
|
Seasonally Adjusted Unemployment Rates |
||
| March 2001: | Alaska 5.8% | U.S. 4.3% |
| February 2001: | Alaska 5.8% | U.S. 4.2% |
| March 2000: | Alaska 6.9% | U.S. 4.0% |
Benchmark: March 2000 Source: Alaska Department of Labor and Workforce Development, Research and Analysis Section.
- Comparisons between different time periods are not as meaningful as other time series produced by Research and Analysis.
- The official definition of unemployment currently in place excludes anyone who has not made an active attempt to find work in the four-week period up to and including the week that includes the 12th of the reference month. Due to the scarcity of employment opportunities in rural Alaska locations, many individuals do not meet the official definition of unemployed because they have not conducted an active job search. These individuals are considered not in the labor force.
###