DATE: Sept. 21, 2001 NO: 01-79 |
CONTACT: |
PHONE: |
(907) 465-2054
|
Department of Labor and Workforce Development |
News Release |
Unemployment Steady at 5.0 Percent in August
August's unemployment rate is slightly higher than in August 2000, but it is still low relative to historic levels. Only three times since 1978 has the state had a lower unemployment rate in August. According to Dan Robinson, a labor economist with the Alaska Department of Labor and Workforce Development, the rising national unemployment rate may soon have an effect on Alaska's labor force. "Layoffs and higher unemployment in the Lower 48 may bring more job seekers to Alaska and make migration out of the state less attractive than it has been in recent years. Both factors would ease what has been a very tight labor market in the state." Most changes in regional unemployment numbers were small. The Anchorage/MatSu region's unemployment rate was unchanged at 4.1%. The Gulf Coast region's rate increased three tenths of a percentage point to 6.4%. The Interior, Northern and Southeast regions all had slightly lower unemployment rates for the month. 
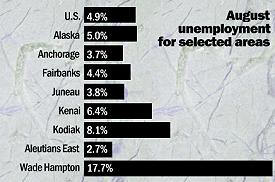
Kodiak saw a big increase, jumping from 4.5% in July to 8.1% in August. Such dramatic swings are not unusual for Kodiak, due to the fluctuations inherent in the fishing industry. As further illustration, July's rate of 4.5% was a drop of over 5 percentage points from the previous month's rate of 9.7%. The Wade Hampton Census Area recorded the month's highest rate at 17.7%, up from last month's rate of 17.4%. The Nome, Yukon-Koyukuk, and Prince of Wales-Outer Ketchikan census areas all saw decreases in their unemployment rates. At 2.7%, the Aleutians East Borough had the state's lowest rate for the month. Wage and salary employment grew by about 1,200 jobs over the month and is up by 1.8% over the year. The construction industry led the way, adding more than 800 jobs. |
Labor Force by Region and Census Area |
||||||||||||
Labor Force | Unemployment | Rate | Employment | |||||||||
08-01 | 07-01 | 08-00 | 08-01 | 07-01 | 08-00 | 08-01 | 07-01 | 08-00 | 08-01 | 07-01 | 08-00 | |
Alaska Statewide ......... | 336,013 | 339,594 | 329,554 | 16,639 | 17,032 | 15,873 | 5 | 5 | 4.8 | 319,374 | 322,562 | 313,681 |
Anch.-MatSu Region | 180,478 | 181,098 | 176,326 | 7,321 | 7,435 | 7,303 | 4.1 | 4.1 | 4.1 | 173,157 | 173,663 | 169,023 |
Municipality of Anchorage | 145,915 | 147,274 | 143,471 | 5,351 | 5,388 | 5,428 | 3.7 | 3.7 | 3.8 | 140,564 | 141,886 | 138,043 |
MatSu Bor. .............. | 34,563 | 33,824 | 32,855 | 1,970 | 2,047 | 1,875 | 5.7 | 6.1 | 5.7 | 32,593 | 31,777 | 30,980 |
Gulf Coast Region ........ | 36,744 | 37,493 | 36,185 | 2,365 | 2,273 | 1,993 | 6.4 | 6.1 | 5.5 | 34,379 | 35,220 | 34,192 |
Kenai Peninsula Bor. .... | 23,533 | 24,197 | 23,377 | 1,495 | 1,620 | 1,459 | 6.4 | 6.7 | 6.2 | 22,038 | 22,577 | 21,918 |
Kodiak Island Bor. ...... | 7,760 | 7,653 | 7,382 | 626 | 345 | 287 | 8.1 | 4.5 | 3.9 | 7,134 | 7,308 | 7,095 |
Valdez-Cordova .......... | 5,451 | 5,643 | 5,426 | 244 | 308 | 247 | 4.5 | 5.5 | 4.6 | 5,207 | 5,335 | 5,179 |
Interior Region .......... | 51,055 | 52,089 | 50,454 | 2,475 | 2,623 | 2,461 | 4.8 | 5 | 4.9 | 48,580 | 49,466 | 47,993 |
Denali Bor. ............. | 1,153 | 1,174 | 1,129 | 48 | 48 | 37 | 4.2 | 4.1 | 3.3 | 1,105 | 1,126 | 1,092 |
Fairbanks North Star Bor. | 45,140 | 46,015 | 44,592 | 2,006 | 2,095 | 1,980 | 4.4 | 4.6 | 4.4 | 43,134 | 43,920 | 42,612 |
Southeast Fairbanks ..... | 2,647 | 2,687 | 2,629 | 212 | 207 | 223 | 8 | 7.7 | 8.5 | 2,435 | 2,480 | 2,406 |
Yukon-Koyukuk ........... | 2,115 | 2,214 | 2,104 | 209 | 273 | 221 | 9.9 | 12.3 | 10.5 | 1,906 | 1,941 | 1,883 |
Northern Region .......... | 8,984 | 9,127 | 8,611 | 983 | 1,026 | 925 | 10.9 | 11.2 | 10.7 | 8,001 | 8,101 | 7,686 |
Nome .................... | 3,380 | 3,451 | 3,231 | 380 | 414 | 349 | 11.2 | 12 | 10.8 | 3,000 | 3,037 | 2,882 |
North Slope Bor. ........ | 3,369 | 3,419 | 3,304 | 278 | 290 | 335 | 8.3 | 8.5 | 10.1 | 3,091 | 3,129 | 2,969 |
Northwest Arctic Bor. ... | 2,236 | 2,256 | 2,076 | 326 | 322 | 241 | 14.6 | 14.3 | 11.6 | 1,910 | 1,934 | 1,835 |
Southeast Region ......... | 42,812 | 43,099 | 42,498 | 1,952 | 2,080 | 1,868 | 4.6 | 4.8 | 4.4 | 40,860 | 41,019 | 40,630 |
Haines Bor. ............. | 1,295 | 1,302 | 1,259 | 61 | 63 | 32 | 4.7 | 4.8 | 2.5 | 1,234 | 1,239 | 1,227 |
Juneau Bor. ............. | 18,823 | 18,910 | 18,713 | 715 | 731 | 707 | 3.8 | 3.9 | 3.8 | 18,108 | 18,179 | 18,006 |
Ketchikan Gateway Bor. .. | 8,294 | 8,292 | 8,174 | 452 | 420 | 376 | 5.4 | 5.1 | 4.6 | 7,842 | 7,872 | 7,798 |
Pr. of Wales-Outer Ketch | 3,340 | 3,400 | 3,389 | 248 | 296 | 314 | 7.4 | 8.7 | 9.3 | 3,092 | 3,104 | 3,075 |
Sitka Bor. .............. | 4,705 | 4,754 | 4,693 | 153 | 184 | 166 | 3.3 | 3.9 | 3.5 | 4,552 | 4,570 | 4,527 |
Skagway-Hoonah-Angoon ... | 2,267 | 2,294 | 2,220 | 130 | 149 | 95 | 5.7 | 6.5 | 4.3 | 2,137 | 2,145 | 2,125 |
Wrangell-Petersburg ..... | 3,745 | 3,805 | 3,724 | 158 | 204 | 157 | 4.2 | 5.4 | 4.2 | 3,587 | 3,601 | 3,567 |
Yakutat Bor. ............ | 342 | 342 | 326 | 35 | 34 | 21 | 10.2 | 9.9 | 6.4 | 307 | 308 | 305 |
Southwest Region ......... | 15,939 | 16,688 | 15,481 | 1,542 | 1,595 | 1,324 | 9.7 | 9.6 | 8.6 | 14,397 | 15,093 | 14,157 |
Aleutians East Bor. ..... | 1,615 | 1,700 | 1,575 | 44 | 53 | 30 | 2.7 | 3.1 | 1.9 | 1,571 | 1,647 | 1,545 |
Aleutians West .......... | 2,101 | 2,236 | 2,054 | 118 | 157 | 104 | 5.6 | 7 | 5.1 | 1,983 | 2,079 | 1,950 |
Bethel .................. | 6,776 | 7,092 | 6,560 | 720 | 743 | 605 | 10.6 | 10.5 | 9.2 | 6,056 | 6,349 | 5,955 |
Bristol Bay Bor. ........ | 513 | 526 | 500 | 36 | 26 | 31 | 7 | 4.9 | 6.2 | 477 | 500 | 469 |
Dillingham .............. | 1,903 | 1,975 | 1,818 | 148 | 135 | 92 | 7.8 | 6.8 | 5.1 | 1,755 | 1,840 | 1,726 |
Lake & Peninsula Bor. ... | 644 | 667 | 637 | 53 | 48 | 56 | 8.2 | 7.2 | 8.8 | 591 | 619 | 581 |
Wade Hampton ............ | 2,386 | 2,492 | 2,338 | 422 | 433 | 407 | 17.7 | 17.4 | 17.4 | 1,964 | 2,059 | 1,931 |
Alaska Nonagricultural Wage & Salary Employment |
|||||
Preliminary | Revised | Changes from | |||
08-01 | 07-01 | 08-00 | 07-01 | 08-00 | |
Total Nonagricultural Employment | 309,800 | 308,500 | 304,200 | 1,300 | 5,600 |
Mining | 12,000 | 11,800 | 10,800 | 200 | 1,200 |
Construction | 18,900 | 18,100 | 18,200 | 800 | 700 |
Manufacturing | 19,100 | 19,600 | 19,200 | -500 | -100 |
Transportation, Commun. & Utilities | 29,900 | 29,700 | 30,200 | 200 | -300 |
Trade | 62,700 | 62,600 | 62,000 | 100 | 700 |
Finance, Insurance & Real Estate | 13,300 | 13,100 | 13,200 | 200 | 100 |
Services & Misc. | 82,200 | 82,000 | 79,100 | 200 | 3,100 |
Government | 71,700 | 71,600 | 71,500 | 100 | 200 |
Seasonally Adjusted Unemployment Rates |
||
Alaska | U.S. | |
August 2001 | 6.7% | 4.9% |
July 2001 | 6.2% | 4.5% |
August 2000 | 6.5% | 4.1% |
Benchmark: March 2000 Source: Alaska Department of Labor and Workforce Development, Research and Analysis Section.
|