Unemployment Rises To 5.6 Percent In October
Nov. 16, 2001
No. 01-88
Alaska's October unemployment rate rose to 5.6% as many seasonal jobs ended, the smallest October increase in more than twenty years. The four tenths of a percentage point rise from September's rate of 5.2% is well below the average September to October increase over the last 20 years. Only once during that period has the state seen a lower rate in October.
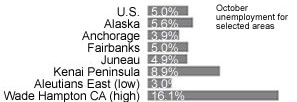
Alaska's continued low unemployment rate is especially significant in light of the rising national rate. The comparable national unemployment rate for October was 5.0%, a three tenths of a percent increase in a month when the national rate historically decreased.
Both the national and state numbers have attracted special attention because October is the first month for which labor market data are available since the September 11 terrorist attacks. "So far, Alaska's labor market is holding steady," according to Dan Robinson, a labor economist with the Alaska Department of Labor and Workforce Development.
A larger than normal increase in initial claims for unemployment benefits may portend higher rates in coming months. Initial claims rose more than 50 percent in October to 9,619, compared to a 30 percent increase over the same period last year. A rise in initial claims may not cause an immediate jump in the unemployment rate, but is often a signal of a weakening labor market.
Regional unemployment rates highlighted the different levels of dependence on seasonal employment. The Denali Borough, largely dependent on the visitor season that slows to a trickle in October, saw its unemployment rate jump from 6.7% in September to 11.6% in October. Skagway, Haines, Juneau and Yakutat also saw noticeably higher rates in October as a result of dramatically fewer tourism and fishing-related jobs.
By contrast, Anchorage's unemployment rate remained at 3.9%, reflecting both less dependence on seasonal employment and a larger supply of alternative jobs for the winter months. Fairbanks' unemployment rate increased slightly to reach 5.0%, three tenths of a percent lower than in October 2000.
For the eighth month in a row, the Wade Hampton Census area had the state's highest unemployment rate at 16.1%, down slightly from last month's rate of 16.4%. The lowest rate in the state was in the Aleutians East Borough at 3.0%.
Wage and salary employment declined by about 13,000 jobs, or 4.3%. For the year, employment is up more than 5,000, a two percent increase.
| Labor Force by Region and Census Area | ||||||||||||
| Labor Force | Unemployment | Rates | Employment | |||||||||
| 1-Oct | 1-Sep | Oct-00 | 1-Oct | 1-Sep | Oct-00 | 1-Oct | 1-Sep | Oct-00 | 1-Oct | 1-Sep | Oct-00 | |
| Alaska Statewide | 328,421 | 328,718 | 323,427 | 18,383 | 17,150 | 18,967 | 5.6 | 5.2 | 5.9 | 310,038 | 311,568 | 304,460 |
| Anchorage-MatSu Region | 182,249 | 178,344 | 178,369 | 7,882 | 7,564 | 8,345 | 4.3 | 4.2 | 4.7 | 174,367 | 170,780 | 170,024 |
| Municipality of Anchorage | 148,668 | 144,878 | 146,106 | 5,850 | 5,608 | 6,161 | 3.9 | 3.9 | 4.2 | 142,818 | 139,270 | 139,945 |
| MatSu Borough | 33,581 | 33,466 | 32,263 | 2,032 | 1,956 | 2,184 | 6.1 | 5.8 | 6.8 | 31,549 | 31,510 | 30,079 |
| Gulf Coast Region | 33,279 | 34,518 | 32,925 | 2,886 | 2,525 | 3,068 | 8.7 | 7.3 | 9.3 | 30,393 | 31,993 | 29,857 |
| Kenai Peninsula Borough | 21,391 | 22,180 | 21,004 | 1,908 | 1,672 | 1,865 | 8.9 | 7.5 | 8.9 | 19,483 | 20,508 | 19,139 |
| Kodiak Island Borough | 6,795 | 7,178 | 6,923 | 488 | 539 | 727 | 7.2 | 7.5 | 10.5 | 6,307 | 6,639 | 6,196 |
| Valdez-Cordova Census Area | 5,093 | 5,159 | 4,998 | 490 | 313 | 476 | 9.6 | 6.1 | 9.5 | 4,603 | 4,846 | 4,522 |
| Interior Region | 49,566 | 50,054 | 49,370 | 2,844 | 2,571 | 3,002 | 5.7 | 5.1 | 6.1 | 46,722 | 47,483 | 46,368 |
| Denali Borough | 1,203 | 1,159 | 1,187 | 140 | 78 | 132 | 11.6 | 6.7 | 11.1 | 1,063 | 1,081 | 1,055 |
| Fairbanks North Star Borough | 43,661 | 44,219 | 43,493 | 2,177 | 2,059 | 2,323 | 5 | 4.7 | 5.3 | 41,484 | 42,160 | 41,170 |
| Southeast Fairbanks CA | 2,633 | 2,596 | 2,626 | 291 | 216 | 302 | 11.1 | 8.3 | 11.5 | 2,342 | 2,380 | 2,324 |
| Yukon-Koyukuk Census Area | 2,069 | 2,080 | 2,064 | 236 | 217 | 245 | 11.4 | 10.4 | 11.9 | 1,833 | 1,863 | 1,819 |
| Northern Region | 9,239 | 9,003 | 9,228 | 893 | 957 | 919 | 9.7 | 10.6 | 10 | 8,346 | 8,046 | 8,309 |
| Nome Census Area | 3,458 | 3,366 | 3,438 | 329 | 349 | 323 | 9.5 | 10.4 | 9.4 | 3,129 | 3,017 | 3,115 |
| North Slope Borough | 3,504 | 3,420 | 3,543 | 280 | 312 | 333 | 8 | 9.1 | 9.4 | 3,224 | 3,108 | 3,210 |
| Northwest Arctic Borough | 2,277 | 2,217 | 2,246 | 284 | 296 | 262 | 12.5 | 13.4 | 11.7 | 1,993 | 1,921 | 1,984 |
| Southeast Region | 39,759 | 41,655 | 38,994 | 2,509 | 2,071 | 2,352 | 6.3 | 5 | 6 | 37,250 | 39,584 | 36,642 |
| Haines Borough | 1,251 | 1,261 | 1,198 | 126 | 65 | 91 | 10.1 | 5.2 | 7.6 | 1,125 | 1,196 | 1,107 |
| Juneau Borough | 17,356 | 18,348 | 17,061 | 847 | 805 | 822 | 4.9 | 4.4 | 4.8 | 16,509 | 17,543 | 16,239 |
| Ketchikan Gateway Borough | 7,720 | 8,045 | 7,529 | 571 | 448 | 497 | 7.4 | 5.6 | 6.6 | 7,149 | 7,597 | 7,032 |
| Pr. of Wales-Outer Ketch CA | 3,065 | 3,276 | 3,075 | 246 | 280 | 302 | 8 | 8.5 | 9.8 | 2,819 | 2,996 | 2,773 |
| Sitka Borough | 4,336 | 4,554 | 4,260 | 186 | 144 | 178 | 4.3 | 3.2 | 4.2 | 4,150 | 4,410 | 4,082 |
| Skagway-Hoonah-Angoon CA | 2,196 | 2,214 | 2,125 | 248 | 144 | 209 | 11.3 | 6.5 | 9.8 | 1,948 | 2,070 | 1,916 |
| Wrangell-Petersburg CA | 3,523 | 3,645 | 3,446 | 253 | 170 | 229 | 7.2 | 4.7 | 6.6 | 3,270 | 3,475 | 3,217 |
| Yakutat Borough | 312 | 314 | 298 | 32 | 17 | 23 | 10.3 | 5.4 | 7.7 | 280 | 297 | 275 |
| Southwest Region | 14,328 | 15,144 | 14,542 | 1,368 | 1,462 | 1,281 | 9.5 | 9.7 | 8.8 | 12,960 | 13,682 | 13,261 |
| Aleutians East Borough | 1,459 | 1,542 | 1,507 | 44 | 49 | 60 | 3 | 3.2 | 4 | 1,415 | 1,493 | 1,447 |
| Aleutians West Census Area | 1,916 | 1,994 | 1,979 | 131 | 109 | 152 | 6.8 | 5.5 | 7.7 | 1,785 | 1,885 | 1,827 |
| Bethel Census Area | 6,051 | 6,446 | 6,128 | 599 | 691 | 550 | 9.9 | 10.7 | 9 | 5,452 | 5,755 | 5,578 |
| Bristol Bay Borough | 465 | 494 | 478 | 36 | 41 | 39 | 7.7 | 8.3 | 8.2 | 429 | 453 | 439 |
| Dillingham Census Area | 1,746 | 1,821 | 1,713 | 166 | 153 | 96 | 9.5 | 8.4 | 5.6 | 1,580 | 1,668 | 1,617 |
| Lake & Peninsula Borough | 586 | 612 | 605 | 54 | 51 | 61 | 9.2 | 8.3 | 10.1 | 532 | 561 | 544 |
| Wade Hampton Census Area | 2,107 | 2,233 | 2,132 | 339 | 367 | 323 | 16.1 | 16.4 | 15.2 | 1,768 | 1,866 | 1,809 |
| Alaska Nonagricultural Wage & Salary Employment | |||||
| preliminary | revised | Changes from | |||
| 10/01 | 09/01 | 10/00 | 09/00 | 10/00 | |
| Total Nonagricultural Employment | 291,100 | 304,300 | 285,400 | -13,200 | 5,700 |
| Mining | 11,700 | 11,900 | 11,500 | -200 | 200 |
| Construction | 16,900 | 18,100 | 16,100 | -1,200 | 800 |
| Manufacturing | 12,000 | 16,100 | 12,200 | -4,100 | -200 |
| Transportation, Commun. & Utilities | 27,000 | 29,100 | 26,700 | -2,100 | 300 |
| Trade | 58,300 | 61,000 | 57,800 | -2,700 | 500 |
| Finance, Insurance & Real Estate | 12,800 | 13,000 | 12,800 | -200 | 0 |
| Services & Misc. | 75,700 | 79,800 | 72,600 | -4,100 | 3,100 |
| Government | 76,700 | 75,300 | 75,700 | 1,400 | 1,000 |
|
Seasonally
Adjusted Unemployment Rates
|
||||
| October 2001: | Alaska | 6.00% | U.S. | 5.40% |
| September 2001: | Alaska | 6.50% | U.S. | 4.90% |
| October 2000: | Alaska | 6.30% | U.S. | 3.90% |
Benchmark: March 2000 Source: Alaska Department of Labor and Workforce Development, Research and Analysis Section.
- Comparisons between different time periods are not as meaningful as other time series produced by Research and Analysis.
- The official definition of unemployment currently in place excludes anyone who has not made an active attempt to find work in the four-week period up to and including the week that includes the 12th of the reference month. Due to the scarcity of employment opportunities in rural Alaska locations, many individuals do not meet the official definition of unemployed because they have not conducted an active job search. These individuals are considered not in the labor force.
###